In the first post (located Here) we talked about the myths about Cholesterol. In this post I am going to do my best to take a very complex issue (something I guarantee about 95% or more of Doctors don’t know) and explain it in an easy to understand way. Lets take a look at how Cholesterol is transported through the body and what causes Coronary Artery Disease (CAD). In the final post on cholesterol we will talk about what you can do to reduce your chances of getting CAD.
How is Cholesterol Transported?
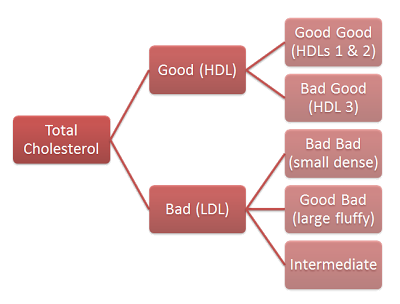
Cholesterol (lipids) needs to get from point A to point B in our bodies. There are two types of substances that travel through our blood stream. Hydrophilic and Hydrophobic. Hydrophilic substances can travel in the blood without assistance because it is not repelled by liquid (like salt or sugar which dissolves in water). Hydrophobic substances need a transporter in order to travel in the blood because they are repelled by liquid (like oil which is repelled by water). Cholesterol is hydrophobic which means to travel around the body it needs a carrier. That carrier is a protein molecule called apoproteins. Once they are bound with cholesterol they are called apolipoproteins (apo). There are two main classes of apo’s, apolipoprotein A-I (apoA-I) and apolipoprotein B (apoB). Almost all apoB in our body is found in low-density lipoprotein (LDL), while most apoA-I in our body is found on high-density lipoprotein (HDL).But this all deals with the surface of the lipoprotein molecule. If you think of this molecule as a ship, this is all dealing with the surface of the ship. But what about the cargo? Remember, these ships are serving as cargo carriers for the cholesterol lipids (both on the surface and inside). Something that is important is the ratio of lipid-to-protein which determines its density. Something with high density is heavier for a given volume than something of low density. A cubic inch of Lead will weight much more than a cubic inch of Styrofoam. Remember this chart from part 1 on cholesterol?
This chart shows the rough breakdown of the different cholesterol particles. Another way to look at this breakdown is based on the following groupings. There are five main classes:
[ordered_list]- high density lipoprotein (HDL)
- low density lipoprotein (LDL)
- intermediate density lipoprotein (IDL)
- very low density lipoprotein (VLDL)
- chylomicron
Now look at this table:
This table shows the relative density of these five groups. Notice the very small difference in density between the most and lease dense lipoprotein. But, also notice the very large difference in diameter (as much as 100 times). The below chart gives us a more visual look at all the different lipoproteins and their composition.
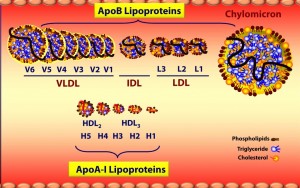 Source: Lecture by Tom Dayspring (source) Source: Lecture by Tom Dayspring (source) |
Note that ApoA lipoproteins (HDL) are tiny compared to ApoB lipoproteins (VLDL, IDL and LDL). This figure is not to scale so the difference in size is actually much greater than shown. As you move in size from larger to smaller, the amount of triglycerides (TG) goes down and protein goes up (in relation to the total volume).
Cholesterol transportation goes both ways. It travels from the gut and liver to our cells (muscles and fat cells for energy, cell repair, etc). It also travels back to the liver, primarily from LDL. So most of the cleaning up of cholesterol (returning it to the liver) is done by the supposed “bad” cholesterol (LDL). The problem is, sometimes LDL can penetrate and deliver it’s cholesterol to our artery walls. This is what we don’t want to have happen. It is the ApoB particle that drives the cholesterol into the artery wall and 90-95% of ApoB particles are LDL.
Coronary Heart Disease (CAD)
The basic process is the LDL particle (LDL-P) crashes into the artery wall and delivers it’s cholesterol. This stimulates an inflammatory response and our immune system kicks in and tries to fix this inflammation by removing the cholesterol from the artery wall. This immune response actually creates a space for more LDL-P to be retained. Sort of like cement holding them in. More and more LDL-P enter the space being created by the immune response. Eventually, through more retention of LDL-P and advanced immune response, not only does the artery narrow, but a cap of tissue forms which is known as plaque. Most heart attacks occur when a piece of this plaque breaks off and blocks blood flow.
So what causes the LDL-P to attach to the artery wall? The main reason is when there is damage or inflammation. This inflammation is primarily due to oxidative damage or oxidation. This oxidation could be in the artery wall (lesion), causing an immune response and thus the build up of white blood cells and LDL particles in the cavity that is created. There can also be oxidation of the LDL particle itself. Studies have shown that oxidated LDL cholesterol is 8 times stronger a risk factor for CAD than normal LDL.
There are also some important things to know about LDL particles. Small dense LDL particles are more likely to become oxidize than large fluffy LDL particles. Small dense LDL particles are more likely to fit into the lesions in the artery wall (vs. large fluffy). One of the problems though is that particle size tests are not standardized and can vary from one test type to the next. Also, there aren’t good ways to measure oxidized LDL. This makes testing somewhat varied. Also, particle size is a secondary factor in that it is only important if your LDL-P is high (more on that below).
So oxidation and inflammation is the major concern with dealing with CAD. What are the 4 primary causes of inflammation and oxidation?
[ordered_list]- Smoking
- Poor Nutrition
- Physical Inactivity
- Stress
We will break down in our next post how we can reduce these causes of oxidation and inflammation.
A Couple Notes about Testing and Variability in Levels:
In one person, studies have shown that with no change in diet or lifestyle, the total cholesterol can vary by about 35 points up or down for no reason at all. HDL can vary up or down about 9 points. LDL by 30 points. The ratio of Total/HDL up or down by 0.8. Triglycerides (TG) about 40 points. This means a couple things. You need to see fairly large changes in your numbers to conclude that something has changed. Second, a single test doesn’t give you the whole picture. You need several tests to see what your average level is. So you could get tested today and have a total cholesterol of 200 and go back in tomorrow and have a level of 235 (or 165) and that is a totally normal variation.
Another important point is that when you are losing weight, your cholesterol levels will be skewed until you settle at a new body weight (cholesterol release into blood from fat cells). So testing cholesterol right after losing significant weight will show higher levels until your weight has settled.
Another example is when you have non-alcoholic fatty liver disease and you change your diet to correct this, the lipids and cholesterol stuck in the liver will be release into the bloodstream and thus raising your TG and LDL numbers. But this is a good thing as your liver is release them to heal and over time the levels will go back down.
Another note is that in a Japanese study (source) they showed that non-alcoholic fatty liver disease can be a really big indicator of risk for Coronary Artery Disease (CAD). Non-alcoholic fatty liver disease increased the risk of CAD by 3 to 4 times for men and about 14 times for women. So there are some scientist that now believe that non-alcoholic fatty liver disease may be one of biggest indicators of future CAD risk.
How to Determine your CAD risk
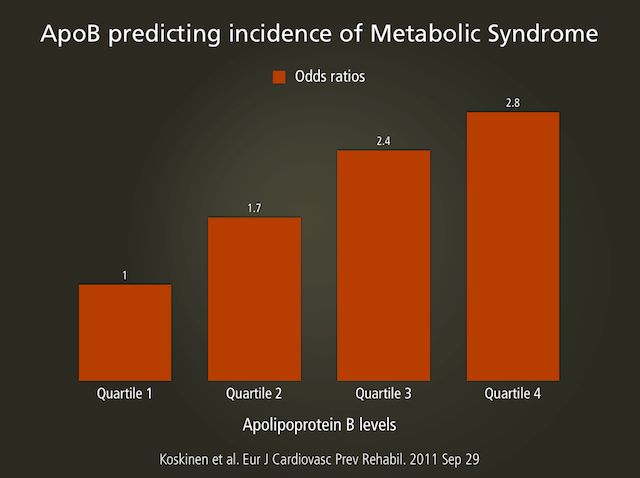
What the latest science has shown is that ApoB or LDL particle (LDL-P) is the best indicators of metabolic syndrome (and thus CAD risk). So what is important is the number of LDL particles not the amount of cholesterol contained in them (LDL-C). (source)
It is sort of a probability game. The more LDL particles there are, the higher the chance they will crash into the artery wall and deliver their cholesterol. The LDL particle number (LDL-P or ApoB) is the best predictor of risk for CAD. Some statements have been made about the size of the LDL particles as being an important factor in determining your risk for CAD (small dense particles due to oxidation are bad, large fluffy good), but the latest science (within the last couple years) shows that this is a secondary factor. The LDL-P number is more important and only when LDL-P is high does the size become important. Take a look at this graph from Quebec Cardiovascular Study, published in 1997, in Circulation.
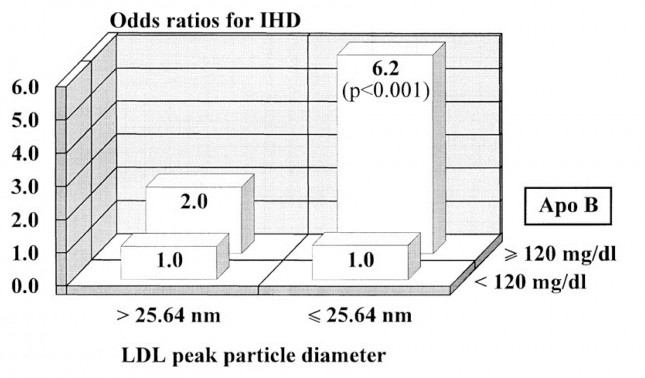 |
| Graph from Quebec Cardiovascular Study, published in 1997, in Circulation (Source) |
What this graph shows is that for patients with low LPL-P (below 120) the size of the LDL particles does not matter (same risk of 1.0). But for those with High LDL-P (above 120) the size becomes very important (Those with larger particles only had a 2X risk versus a 6.2X risk for those with the smaller particles).
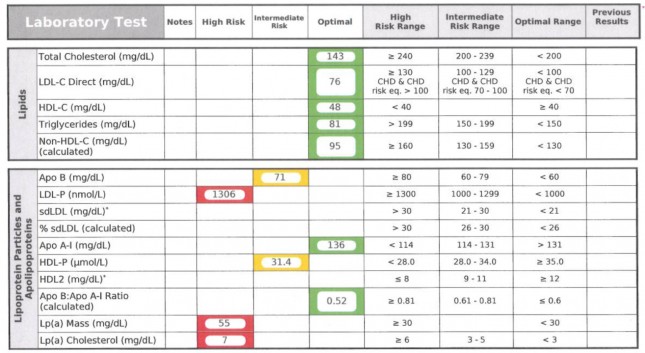
There are several methods for measuring cholesterol, but I will not go into detail about the all of them (THIS source does it much better than I would). However, let’s look at the one test that is the most important. The best measurement and only one that actually directly counts theLDL-P is nuclear magnetic resonance spectroscopy or NMR for short (called NMR LipoProfile). Here is what an NMR report looks like.
 |
| Source Here |
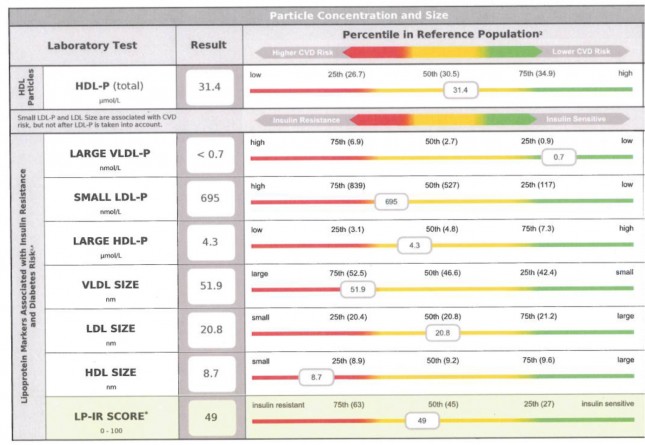
This test counts the total LDL particles (LDL-P), HDL particles (HDL-P), apoB and apoA-I. It also measures the size of each particle. The particle size is very telling when it comes to predicting insulin resistance (and Metabolic Syndrome). In the results below you can see that this person has small VLDL particles and small HDL particles. When there are large VLDL-P, large VLDL size, increased small LDL-P, small LDL size, reduced large HDL-P, small HDL size are markers for insulin resistance. These findings can precede more conventional signs for insulin resistance in many cases by several years.
 |
| Source Here |
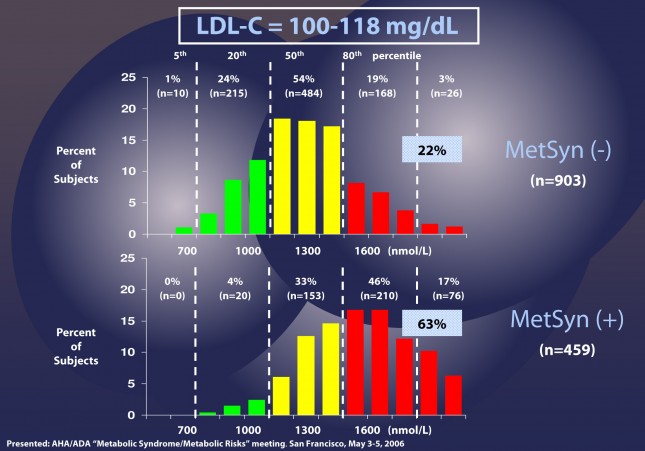
What is important to note here is that the traditional LDL cholesterol (LDL-C) of traditional tests given by most doctors today isn’t the same as LDL particles (LDL-P) and doesn’t necessarily correlate to LDL-P. In other words if your LDL-C is low, your LDL-P could still be high (more particles which are smaller and contain less cholesterol). This is particularly true for those with metabolic syndrome and diabetes. (below is from HERE with my own text to help easier understanding of this complex issue)
Patients with LDL-C between 100 and 118 mg/dL are shown without metabolic syndrome (top) and with metabolic syndrome (bottom). In the patients without metabolic syndrome, LDL-C under-predicts cardiac risk 22% of the time. However, when you look at the patients with metabolic syndrome, you can see that 63% of the time their risk of cardiac disease is under-predicted.
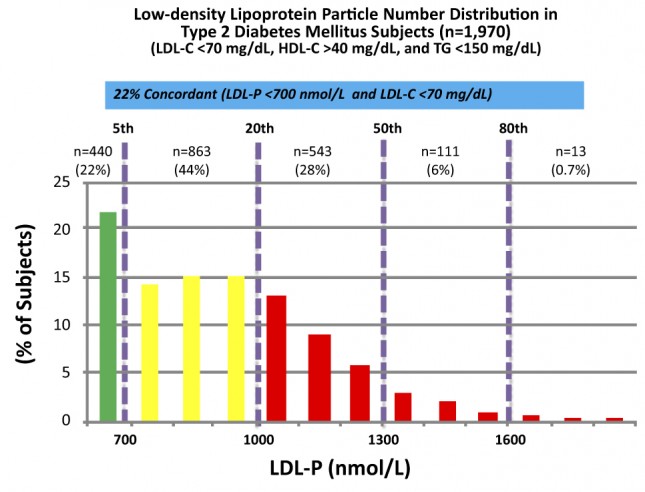
The above data was collected from nearly 2,000 patients with diabetes who presented with “perfect” standard cholesterol numbers: LDL-C less than 70 mg/dL; HDL-C greater than 40 mg/dL; TG less than 150 mg/dL. But only 22% of the time did the LDL-P (the real indicator of risk) equal the LDL-C levels. Remember that LDL-C less than 70 mg/dL is considered VERY low risk (5th percentile). But with LDL-P the real risk for 35% of these patients was above 1000 nmol/L (above 20%) and 7% were HIGH RISK. When you do this analysis with less stringent LDL-C criteria (LDL-C less than 100 mg/dL) the number of patients in the high risk group is even higher. This shows that for many people with metabolic syndrome or diabetes, the LDL-C numbers inaccurately report their real risk for CAD.
Summary:
To summarize this very complex issue, LDL particle number (LDL-P) is a great indicator of Metabolic syndrome and is the most accurate predictor of CAD risk, not the traditionally used LDL-C. The best test for LDL-P is NMR LipoProfile. There are many other markers that can give you information about what is going on in the body (Triglycerides, Ratio of Total cholesterol to HDL, Total HDL levels, etc.) but none of them on their own accurately predict the risk of CAD except LDL-P. Also, non-alcoholic fatty liver disease is a very good predictor of future CAD (again linking it to inflammation).
But, by far the best predictor is your inflammation. If you have very low inflammation, the cholesterol numbers don’t really matter much in most cases. Remember, cholesterol is the firefighter coming to put out the fire (inflammation). Inflammation is what causes CAD. In general we look for things like A1c (ideally 5 or less) and Triglyceride to HDL ratio (2 or less, ideally 1 or less) to know how much inflammation you have.
In the next post (Located HERE)we will talk about how to reduce your LDL-P and your risk of coronary artery disease.






Since low carb my doctor was thrilled when my cholesterol dropped and blood sugar as well. But he wants me to cut back on my fat. My liver is considered fatty.
Dana Powers
I will have more on this in the next article. Fat consumption doesn’t cause non-alcoholic fatty liver disease. Sugar and fructose are big contributors. 🙂
Three and half years ago at the age of 39 yrs, I had four stints put in for 90-99% blocked arteries. I have history of hyperlipidemia, hypertension, diabetes, and heart disease. I went from hardly no medication to 14 meds overnight. Last May I learned importance of low glycemic foods and have been learning a healthy lifestyle of eating. I continue to research and learn on daily basis. I have lost a total of 34 lbs ( most during first 2 months), I had to discontinue insulin shots almost immediately – due to drastic decrease in sugar levels. I discussed with my cardiologist about discontinuing 40 mg of Crestor and other cholesterol meds, along with plavix and 4 blood pressure meds. He originally said that I would never get off of them because of my genetics but at last visit did say I could lower doses ( against his recommendations) and play with it to see how I do. My Ha1C is 5.2 without insulin for almost a year. The last cholesterol levels with meds few months back were … total cholesterol101… triglycerides180…HDL38…VLDL36….LDL 27.
I am going next week to get more labs done. Last month I stopped my cholesterol med, Zetia, and decreased the Crestor to 20 mg. I also stopped intake of soy, corn, and wheat products. My goal is to be drug free and to lose another 40 lbs. I really started paying attention to what is in our food and am amazed of how much soy and wheat is in everything. I am going back to the basics, back to REAL FOOD! Still trying to figure this cholesterol stuff out – what’s what…Not sure how how labs will read and how happy Dr will be with numbers ‘ he’s looking for’, but I know I will feel better and be better. Love your posts and recipes!
Thank you! Way to go! Keep up the good work and you will get there! 🙂
Bluegrassmom
From other studies I have read a TC of 101 is dangerously low. You can go to low on LDL and TC. Remember – cholesterol is a absolutely necessary part of our physiology and forms the basis of cell walls and is vital in the functioning of the brain.
Taking statins has been associated with poor memory and cognitive functioning.
There is a place in between but personlly, if my LDL came back that Low I would be seriously frightened.
This information is based on my reading and studies but I did want to put a warning in here for you to consider and do more of your own independent study.
For your very best health, Laura
She is still on medication from what I read. Yes, you are correct, that reading was dangerously low. I am interested what the numbers are now that she is off the medication.
Laura
Thank you for your reply. I have questioned Dr about the TC being to low at 101 ( it was 90 check up before that one). He told me that was great and wanted it to stay in that range. I had a friend few years ago, whose TC was 73 and drs were concerned for her life. This cardiologist thought mine was the greatest.
As for my LDL of 27, this is actually up from years of being lower . Any suggestions on getting it higher?
You might want to check with another doctor. One way would be for the doctor to take you off of the drugs. Increasing your saturated fat intake helps too. 🙂
This is great info, Maria! I read some of this stuff on Dr. Peter Attia’s blog last week. I look forward to your next post about how to get the LDL particle number lower.
I haven’t had the chance to get an NMR Lipid profile yet, but that is one my agenda. I recently had blood work done here in Canada (they use the old indirect method), and my doctor was pleased that I’m doing so well, since adopting a low carb way of eating, with your help and Dr. Davis, too. Unfortunately, my doctor didn’t think it was a good idea to give up my cholesterol lowering meds. I think I need a second opinion. Thanks for all the work you do. You are a blessing to so many!!!
Steve A.
Thank you! Print out these studies and give them to your Dr. Can’t hurt. 🙂
thank you for helping me understant better this issue
Norma
Thanks!
Thank you for your so cool post,it is useful,i love it very much.please share with us more good articles.
I want to thank the both of you, again, for posting about this. I look forward to the next instalment. :thumbsup:
A retired engineer/professor, who did his own research into cholesterol after his doctor wanted to prescribe statins for him (mainly because of his age and the “every one is taking them” mentality), came to the conclusion that too many doctors get their information on the dangers of cholesterol from statin salespeople. I am beginning to see his point!
Thank you! 🙂
My husband is type I diabetic for 40 yrs and his endocrinologist just prescribed 5mg/day of Crestor as a preventative to heart disease, which is so prevalent in diabetics. Do either you or Craig have any thoughts on taking a statin for this type of prevention? Thank you for this wonderful info in understandable language!
Thanks Stephanie. The only studies I have seen where statin drugs can show a reduction is death rates are for men who have already had a heart attack. I have seen none that show it is good for preventing. In my opinion, I would get a NMR LipoProfile and check the LDL-P number to properly assess his risk level. If it is high, then use the suggestions in my next post on how to lower his risk (which is also good for his diabetes). 🙂
Great information Maria. I was wondering if you will be covering, or did I miss information on Lipoprotein A. In the past, I have had good ratio of LDL/HDL, but elevated Lipoprotein A. Is it true that this is genetically based?